
Quick Answer: Power BI vs Custom Dashboard App
Use Power BI, Tableau, Looker Studio, or a similar BI tool when your team mainly needs internal analysis, executive reporting, scheduled dashboards, and fast insight from structured data. Use embedded analytics when an existing SaaS product or portal needs governed charts inside the user experience without rebuilding a full analytics engine. Build a custom dashboard app when reporting must support customer-facing access, workflow actions, custom roles, branded UX, complex integrations, operational alerts, or decisions that go beyond charts.
The question is not whether Power BI is good or whether custom software is more flexible. Both can be the right answer. The practical decision is whether your dashboard is an analytics surface, a product feature, or an operating system for a business workflow. If it is the last two, a purpose-built web app development approach for dashboards and portals often gives teams more control over permissions, workflows, data models, and user experience.
Why This Decision Gets Expensive
Dashboard projects become expensive when teams buy for today's chart request and ignore tomorrow's operating model. A department may start with a few management reports, then ask for external client access, row-level permissions, write-back actions, approval workflows, audit trails, alerts, exports, and integrations with CRM, ERP, billing, support, or product usage data. At that point, the dashboard is no longer just a dashboard.
The OrangeMantra dashboarding reference page reflects the same market pattern: buyers compare BI platforms, custom dashboards, data visualization frameworks, databases, and cloud deployment models in one evaluation. That mix is a signal that many teams are not choosing a tool in isolation. They are choosing how reporting will fit into the product and operations stack.
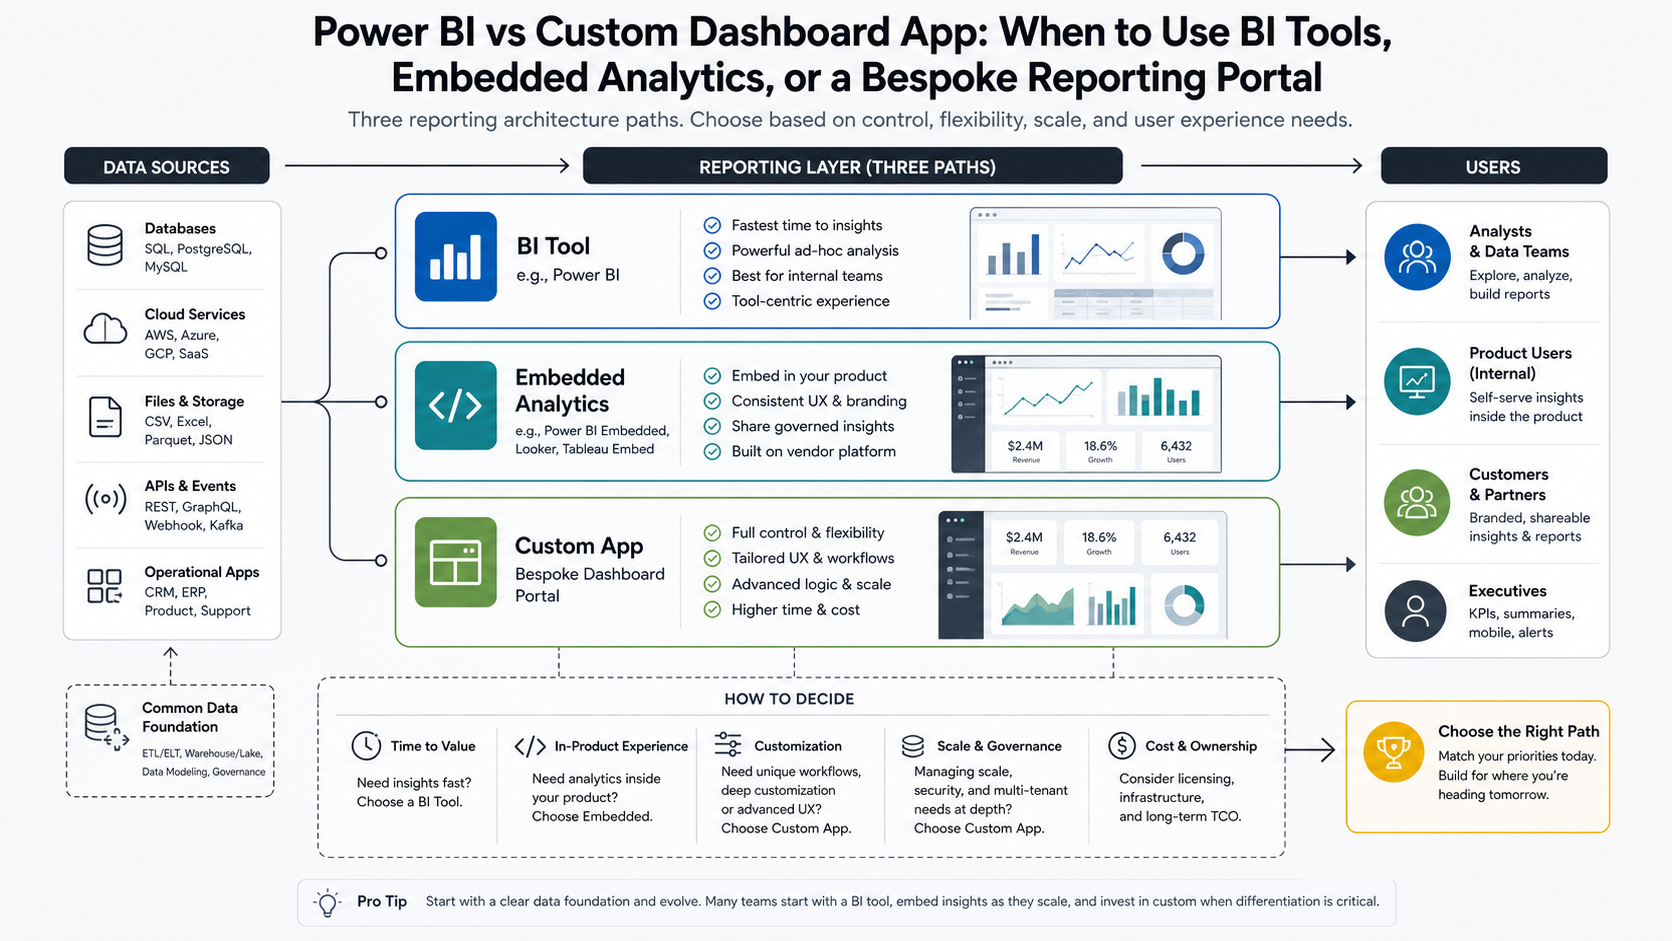
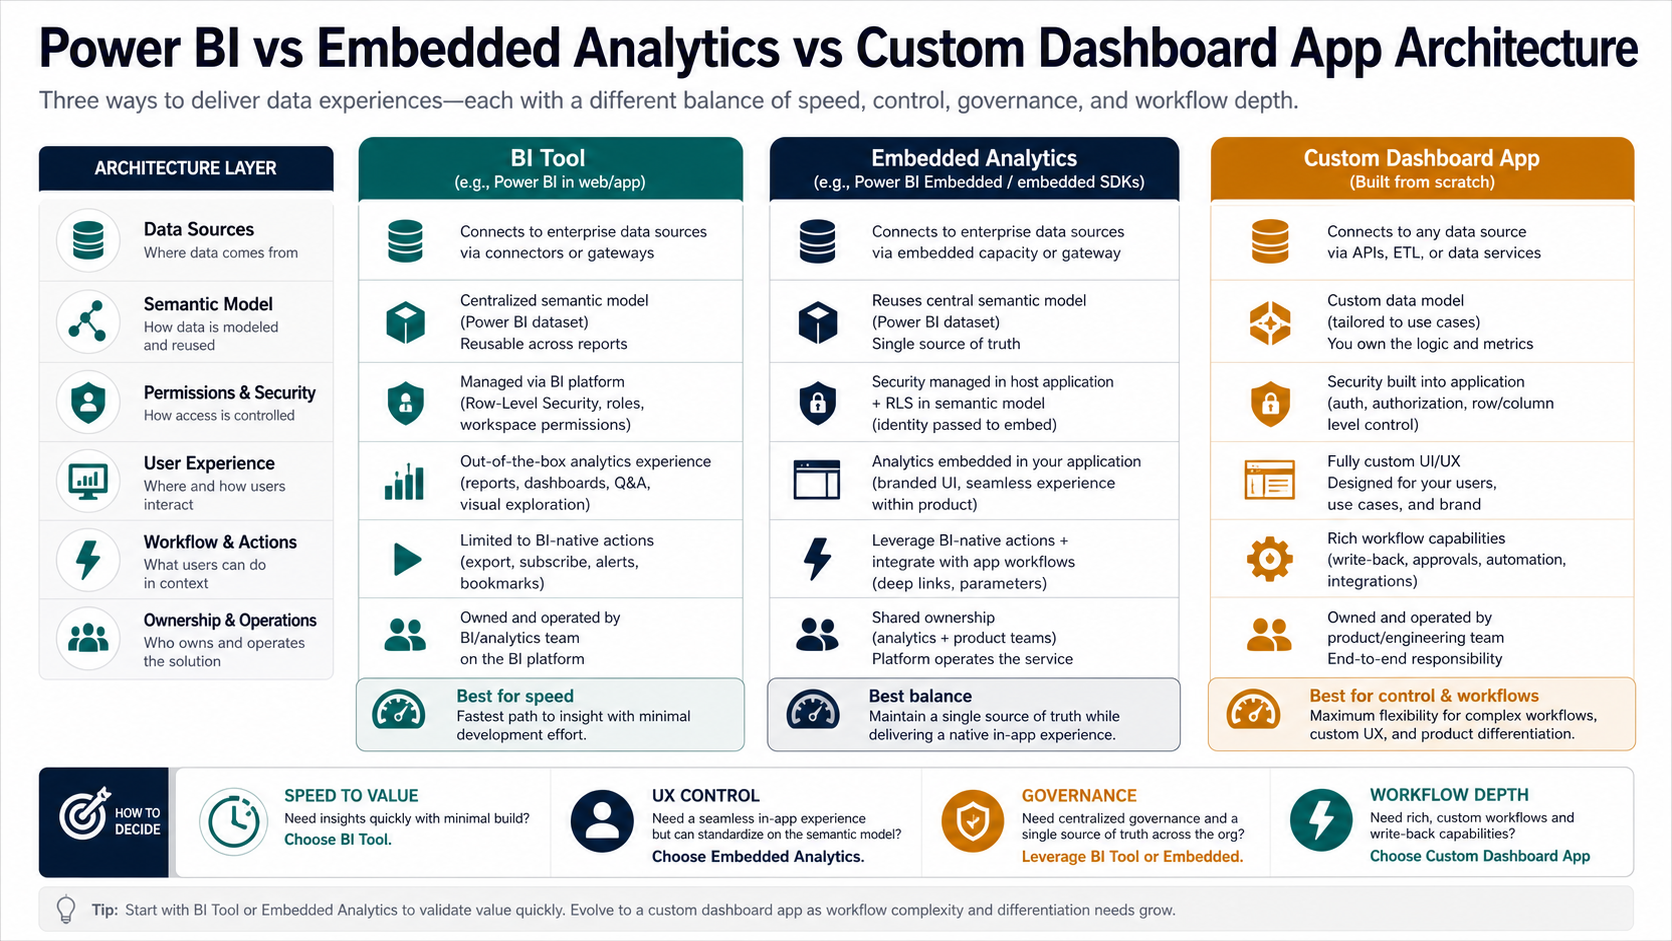
The Three Main Dashboard Architecture Options
Option 1: BI Tool
A BI tool is usually the fastest path when the core job is to analyze data, build management reports, monitor KPIs, and let internal business users slice information without waiting for engineering every week.
- Best for internal analytics, finance reporting, sales dashboards, operational scorecards, and executive views.
- Strong when data is already clean, centralized, and governed.
- Useful when analysts need self-service exploration and business users need scheduled dashboards.
- Less ideal when users need a highly branded workflow, heavy write-back, customer-facing access, or app-specific interaction patterns.
Option 2: Embedded Analytics
Embedded analytics puts reports, charts, or BI experiences inside another application. It can be a strong middle path for SaaS companies and internal portals that need reporting inside an existing product but do not want to build every charting, filtering, and export capability from scratch.
- Best for SaaS dashboards, customer portals, partner reporting, and product analytics inside an existing app.
- Strong when the product team needs speed but still wants a more integrated user journey.
- Useful when permissions, tenant isolation, and design control are manageable inside the chosen analytics platform.
- Less ideal when the analytics layer must drive many custom workflows, approvals, data entry, or unique interaction models.
Option 3: Custom Dashboard App
A custom dashboard app is a purpose-built web application for reporting, decision support, and workflow, usually delivered through a focused custom dashboard development services plan. It may still use charting libraries, BI APIs, data warehouses, or embedded components, but the product experience, data permissions, business rules, and integrations are designed around your users.
- Best for customer-facing portals, operational command centers, marketplace dashboards, logistics tracking, field operations, financial workflows, and industry-specific reporting products.
- Strong when users must act on the data, not only inspect it.
- Useful when the dashboard needs custom roles, tenant-specific branding, alerts, workflows, collaboration, audit trails, billing-aware access, or complex integrations.
- Less ideal when the only requirement is quick internal KPI reporting and the data model is straightforward.
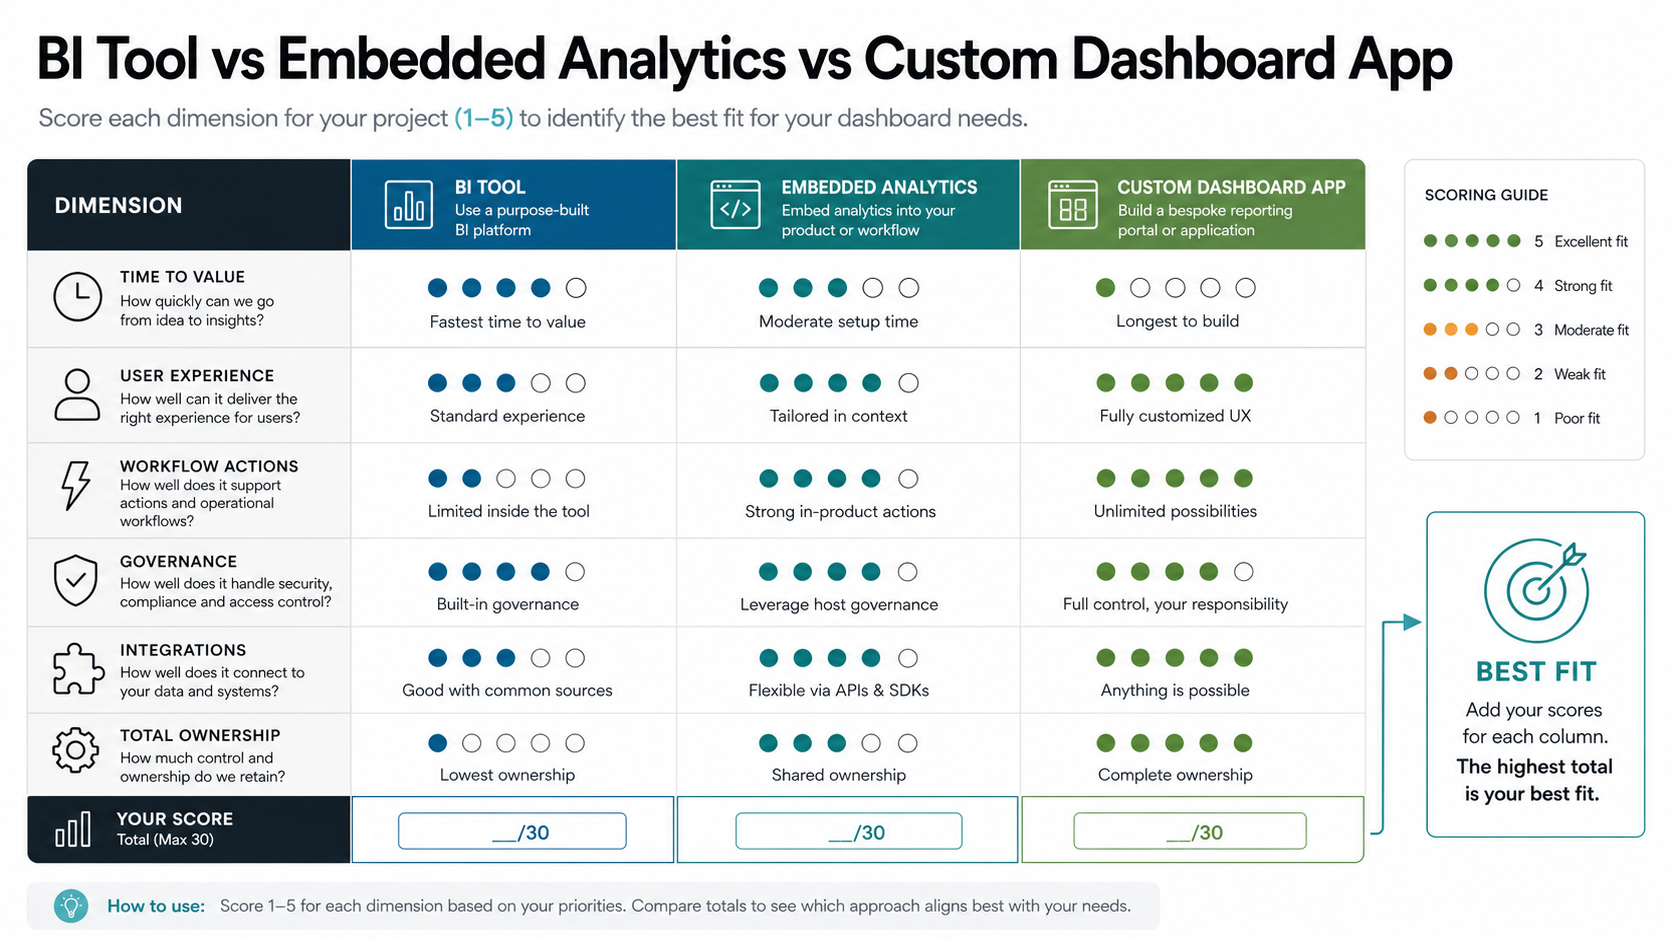
Decision Matrix: BI Tool, Embedded Analytics, Or Custom App?
| Decision Factor | BI Tool | Embedded Analytics | Custom Dashboard App |
|---|---|---|---|
| Time to first dashboard | Usually fastest when data is ready | Fast if product integration is simple | Slower because UX, backend, and workflows are built |
| User experience control | Limited to platform conventions | Moderate, depending on embedding options | Highest control over layout, flows, and branding |
| Workflow actions | Weak for custom actions and approvals | Moderate for simple in-product actions | Strong for write-back, approvals, alerts, and collaboration |
| Customer-facing access | Possible, but licensing and UX can be awkward | Often a good fit for product dashboards | Best when access rules and experience are product-specific |
| Integrations | Strong for common connectors | Depends on host app and analytics platform | Strongest for custom APIs, legacy systems, and workflows |
| Total ownership | Lower build effort, ongoing license and governance work | Mixed platform, integration, and product maintenance cost | Higher build responsibility, highest long-term flexibility |
When Power BI Or Another BI Tool Is Enough
A BI tool is usually enough when the dashboard is primarily for internal teams, the data can be modeled in a warehouse or semantic layer, and the output is mostly charts, filters, drilldowns, scheduled reports, and leadership views. This is common for finance, sales, marketing, support, inventory, and operational reporting.
Choose this path when speed matters more than product-level UX control, users are comfortable inside BI interfaces, and the business can accept the platform's permission model, sharing model, export behavior, and licensing structure. It is also a good default when teams are still discovering which metrics matter and need flexible exploration before committing to a custom product experience.
When Embedded Analytics Is The Better Middle Path
Embedded analytics is worth considering when the dashboard must appear inside a product, client portal, or internal system, but the core need is still governed reporting. It helps product teams ship analytics faster while keeping users in the surrounding application experience. If the reporting stack is mainly Microsoft, compare this route with a focused Power BI consulting and dashboard development plan so capacity, semantic models, refresh rules, and embedding ownership are estimated before build work starts.
This option works best when the host app already handles authentication, navigation, billing, and customer account structure, while the analytics platform handles charts, dashboards, and filters. It becomes less attractive when the embedded layer starts fighting your product requirements: custom workflows, nonstandard interactions, complex data writes, or detailed tenant-specific logic.
Power BI Embedded Considerations Buyers Should Validate
Power BI Embedded can be a strong middle path, but buyers should validate the operating model before assuming it behaves like a fully custom product feature. Microsoft documents customer-facing and organization-facing embedding patterns: app-owns-data for external customers who should not need Power BI credentials, and organization embedding for signed-in internal users. Production embedding also requires an appropriate capacity such as A, EM, P, or Fabric F SKU, plus clear ownership for publishing content, semantic models, workspaces, and refresh operations. That makes capacity planning, tenant design, and report ownership part of the architecture decision, not only procurement details.
- Capacity and licensing: confirm whether the dashboard will run on Power BI Embedded, Premium, or Fabric capacity, and model peak concurrency before promising customer-facing analytics.
- Security model: test row-level security, object-level security, workspace isolation, service principal profiles, and embed-token identity rules against the real tenant and account hierarchy.
- Product fit: prototype the exact navigation, filtering, export, drill-through, bookmark, mobile layout, and action workflows users need before committing to an embedded analytics path.
- Fallback architecture: decide which parts stay in BI and which parts need custom application logic for alerts, approvals, annotations, billing-aware access, audit trails, or write-back actions.
- Operational ownership: name who owns dataset refresh failures, capacity throttling, report versioning, embed-token services, access reviews, and customer support when analytics becomes part of the product.
If those constraints feel heavier than the charting requirement itself, treat embedded analytics as one component inside a broader custom software development plan instead of the whole dashboard product.
When A Custom Dashboard App Is Justified
A custom dashboard app is justified when data is part of an operational workflow. If users need to approve exceptions, assign work, comment on records, trigger alerts, update statuses, manage customer-visible views, or connect reporting to business actions, a dashboard becomes software.
Common signs you need a custom app include:
- Multiple user roles with different dashboards, permissions, and actions.
- Customer-facing or partner-facing reporting where branding and UX matter.
- Workflow actions such as approve, assign, escalate, annotate, export, invoice, or notify.
- Integrations with CRM, ERP, warehouse, billing, support, IoT, logistics, or product systems.
- Near-real-time data, alerting, anomaly detection, or operational command-center needs.
- Industry-specific data models that generic BI pages cannot express cleanly.
- Audit trails, usage tracking, tenant isolation, or custom compliance evidence.
For teams planning this path, the budget question should be tied to roles, integrations, data quality, and workflow depth. The Custom Software Cost Estimator can help frame the likely effort before the team overcommits to a build.
Cost And Scope Drivers For Dashboard Projects
BI tool projects usually spend budget on data modeling, source connectors, report design, permissions, governance, training, and licensing. Embedded analytics adds product integration, tenant mapping, authentication, theming, and performance work. Custom dashboard apps add frontend UX, backend APIs, database design, role management, workflow logic, notification rules, testing, deployment, and long-term product maintenance.
The main cost drivers are not chart count alone. They are data readiness, number of source systems, permission complexity, refresh frequency, workflow actions, user roles, export/reporting requirements, security controls, mobile responsiveness, and the amount of business logic hidden behind each metric. For a broader software budgeting lens, use the custom software development cost guide and the web app development cost guide alongside the dashboard-specific decision matrix.
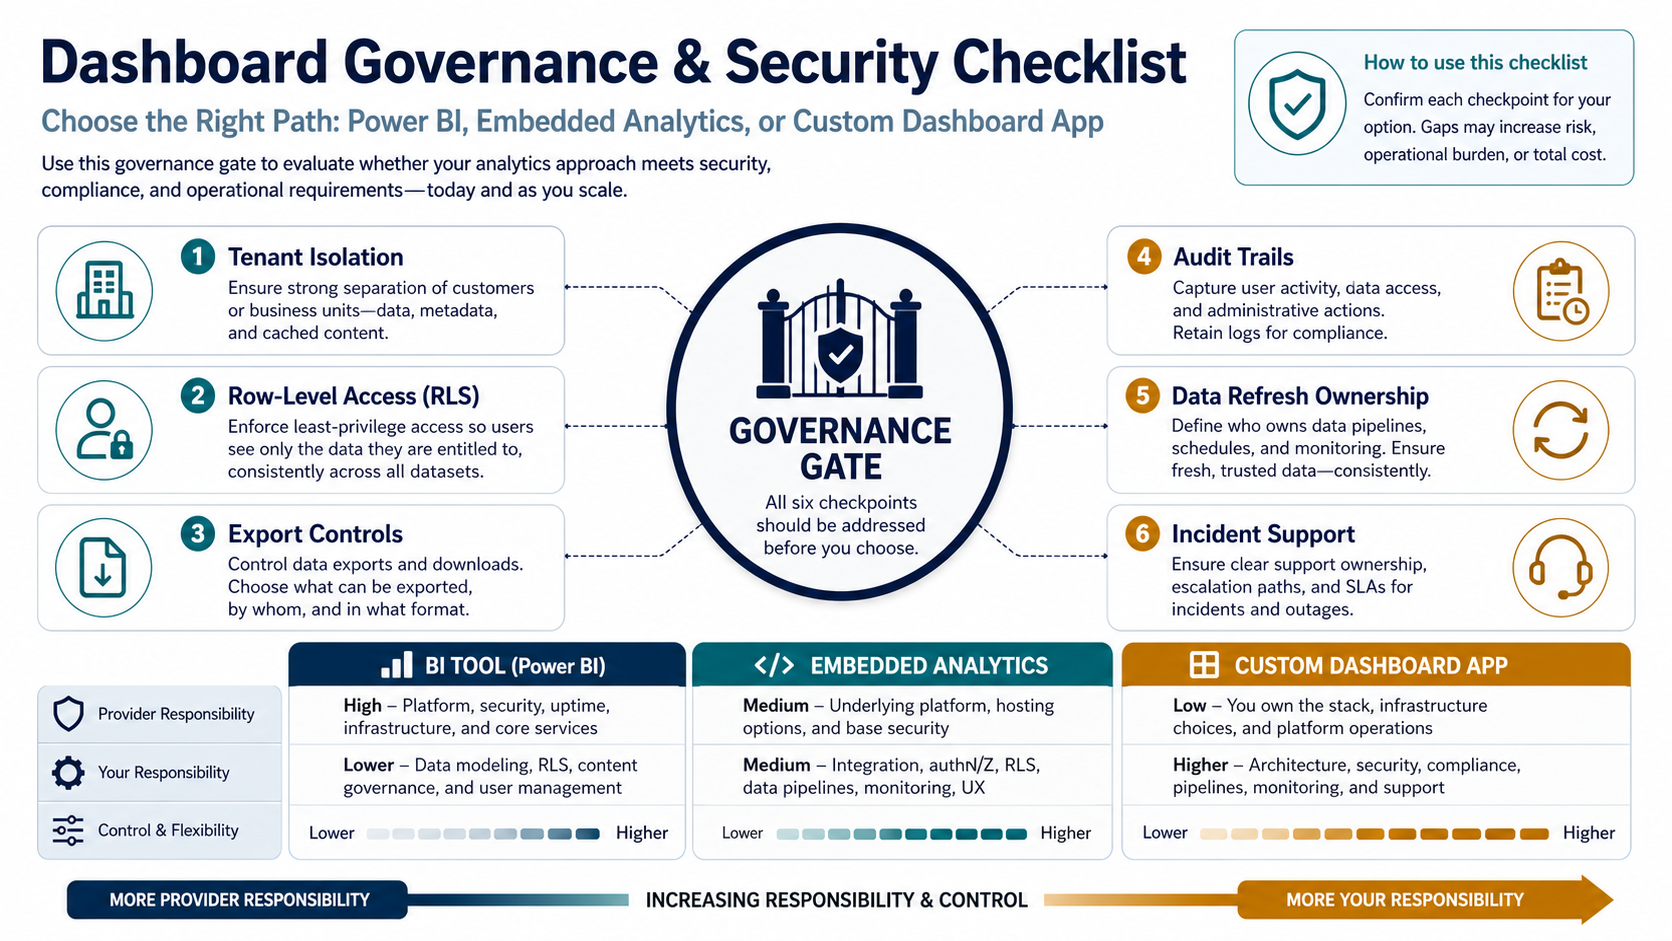
Security And Data Governance Considerations
Dashboard architecture affects access control. Internal BI reports may be acceptable with workspace-level permissions and row-level security. Customer-facing dashboards often need stricter tenant isolation, account-level audit trails, role-based access, secure exports, and careful handling of personally identifiable information or commercial data.
Before choosing a platform, define who can see each data slice, who can export data, how access is revoked, where cached data lives, how dashboard usage is logged, and what happens when a customer, partner, or employee changes roles. If the answer requires custom policy logic or workflow-specific audit records, that is a strong signal for custom application architecture or a hybrid approach. Teams that need dashboard evidence tied to operational behavior should also review proof-oriented product work such as the HeatPilot portfolio case study, where analytics-style decisions depend on trusted context rather than isolated charts.
A Hybrid Approach Is Often Best
The best answer is sometimes not pure BI or pure custom software. Many teams use a BI platform for internal analysis, embed selected dashboards inside a product for customer reporting, and build custom app layers for workflows, permissions, and operational actions. This keeps analysts productive while giving users a cleaner experience where it matters.
A practical hybrid architecture might use a warehouse and BI model for trusted metrics, a custom web app for authentication and workflow, embedded charts for common analytics views, and custom components for actions such as approvals, alerts, annotations, and account-specific reporting.
2026 Buyer Validation Checklist
Before funding a BI, embedded analytics, or custom dashboard path, run a proof gate with real users and real data. The proof should include one executive view, one operational workflow, one customer or tenant-specific view when relevant, one export scenario, and one failure mode such as late data, stale refresh, or revoked access. A dashboard decision is ready for build only when the team can explain who owns the data model, who approves KPI definitions, how permissions are tested, and what evidence proves the dashboard is trusted after launch.
| Validation Area | What To Prove | Risk If Skipped |
|---|---|---|
| Data model | Trusted KPI definitions, source ownership, refresh cadence, and reconciliation checks. | Users debate the numbers instead of acting on them. |
| Access model | Roles, tenant boundaries, RLS/OLS behavior, exports, and revocation flow. | Customer or department data leaks across audiences. |
| Workflow fit | Alerts, approvals, comments, drill-through, write-back, and handoff actions. | The dashboard becomes a static report beside the real work. |
| Operating model | Capacity monitoring, refresh failures, versioning, support owner, and change process. | The launch works, but the dashboard degrades after the first data or org change. |
Implementation Roadmap
Step 1: Define The Dashboard Job
Write down what users need to decide or do after viewing the dashboard. If the answer is "understand performance," BI may be enough. If the answer includes actions, exceptions, collaboration, or customer workflows, evaluate embedded or custom options.
Step 2: Map Data And Ownership
List the source systems, refresh needs, data owners, quality gaps, metric definitions, and access rules. A dashboard project without shared metric definitions quickly becomes a trust problem.
Step 3: Prototype The Hardest Workflow
Do not prototype only the easiest chart. Prototype the hardest permission rule, slowest integration, most important user role, or most business-critical action. That test will reveal whether BI, embedded analytics, or custom software is the right path.
Step 4: Plan The Operating Model
Decide who owns data quality, dashboard changes, user support, access reviews, security, and performance monitoring. Tool choice matters, but ownership determines whether the dashboard stays useful.
How NextPage Helps
NextPage helps teams choose and build the right dashboard architecture for their product and operations. That can mean a BI reporting setup, an embedded analytics plan, or a custom dashboard application with APIs, roles, workflows, integrations, and user-friendly reporting.
If your dashboard is moving beyond internal reporting into customer access, workflow actions, or complex integrations, start with a dashboard architecture review. Request a dashboard architecture consultation to compare BI tools, embedded analytics, and a custom reporting portal before committing to the wrong implementation path.