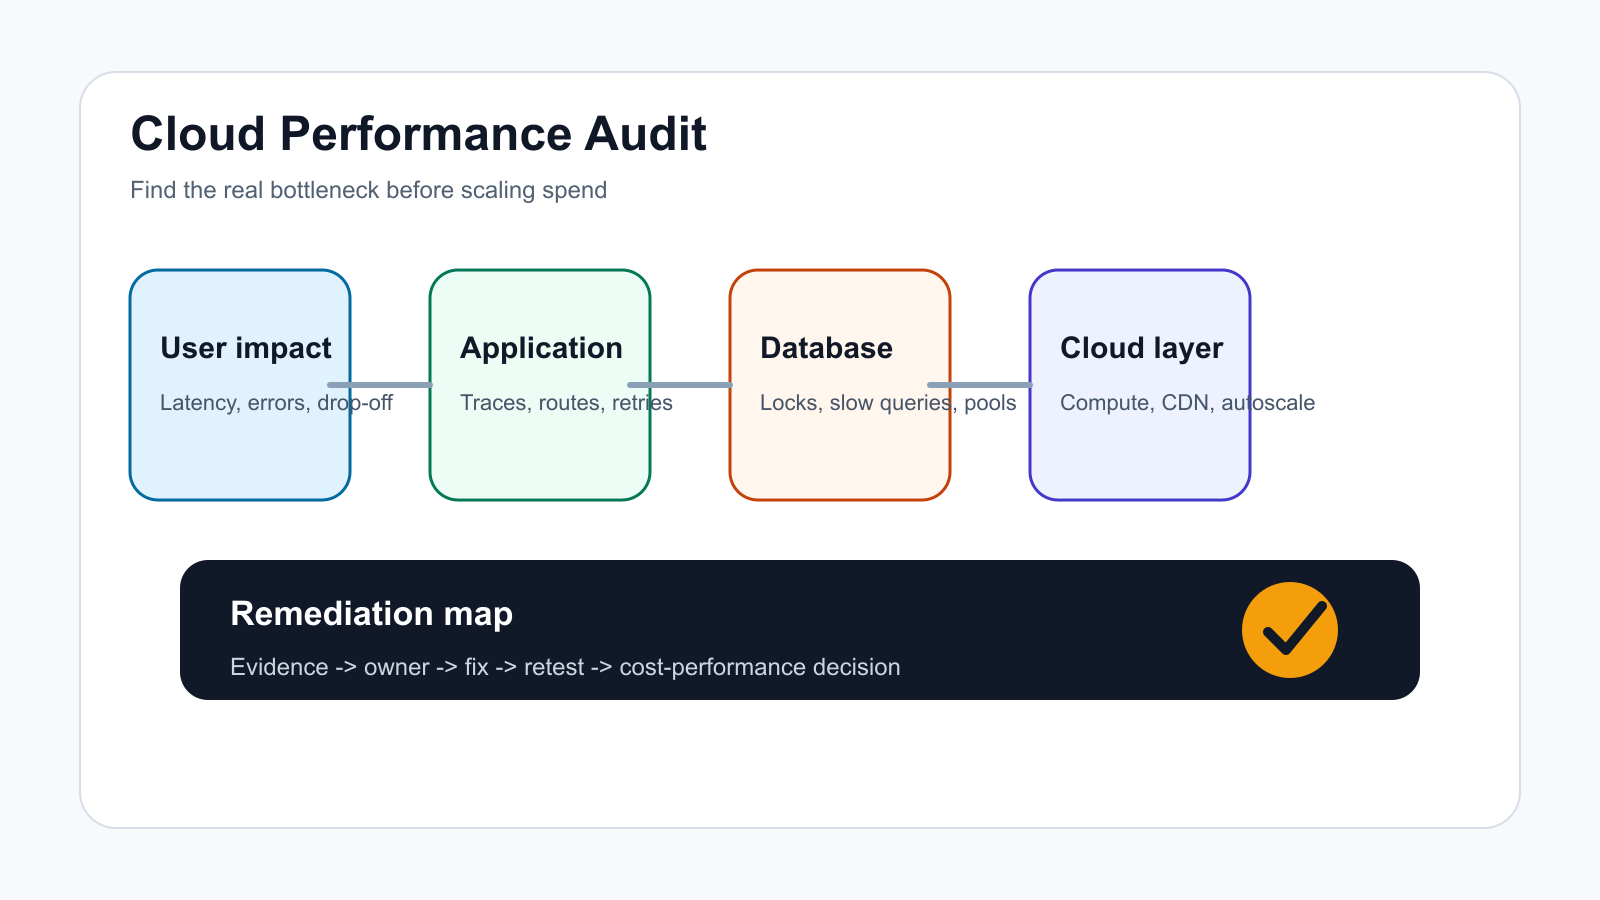

A cloud performance audit is the work you do before adding more servers, buying a larger database tier, or rewriting architecture under pressure. It connects user-facing symptoms to infrastructure, application, database, network, observability, and cost evidence so the team knows which bottleneck is real.
The mistake is treating every slow page as a scaling problem. Some workloads need more capacity, but many need better caching, query tuning, queue design, CDN rules, autoscaling thresholds, release hygiene, or observability. Use this checklist to separate those decisions before cloud spend grows.
For teams planning a performance sprint in 2026, the best audit output is not a generic health report. It is a ranked backlog that connects each user-visible symptom to logs, traces, database evidence, infrastructure metrics, cost impact, and a retest plan.
Quick Answer: What Should A Cloud Performance Audit Include?
A cloud performance audit should include business-critical workflows, current service-level targets, real user latency, error rates, throughput, compute utilization, database wait time, cache hit rate, network and CDN behavior, queue depth, deployment changes, autoscaling settings, observability gaps, and cost-performance tradeoffs. The output should be a prioritized bottleneck map with owners, evidence, likely fixes, and retest criteria.
If the audit shows that the current hosting model, deployment process, or workload placement is the constraint, connect the findings to a broader cloud migration assessment or a focused cloud performance optimization sprint instead of tuning one service in isolation.
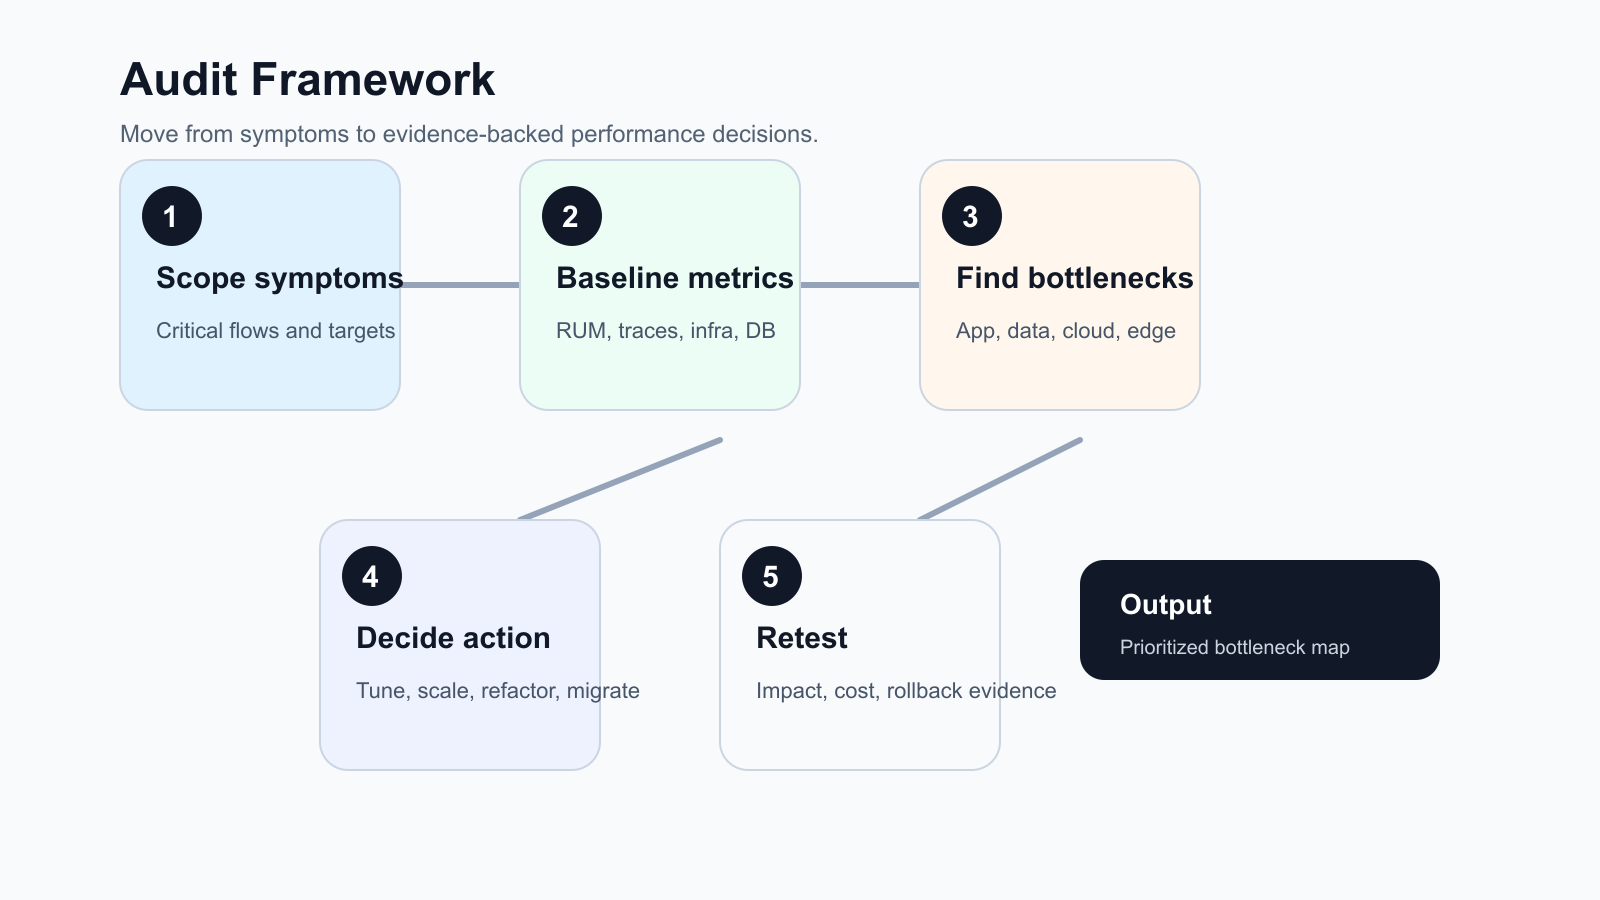
1. Define The Audit Scope Around User Impact
Start with the workflows that matter to revenue, operations, or customer trust. For a SaaS product, that may be login, dashboard load, search, exports, billing, API calls, and background jobs. For ecommerce, it may be product listing, cart, checkout, payment callbacks, inventory sync, and order confirmation; teams with storefront traffic spikes should also compare the audit against an ecommerce cloud performance optimization plan. For an internal tool, it may be the queue, approval, reporting, or data-entry flow that blocks employees.
Write down the current symptom in plain language: pages are slow after campaigns, reports time out, background jobs pile up, checkout fails during peaks, API customers see intermittent 5xx responses, or cloud bills rise without better performance. Then attach the measurable target: p95 latency, error budget, throughput, job completion time, CPU saturation, database lock time, or cost per successful transaction.
Also define the audit boundary before pulling data. A tight audit may cover one customer workflow and one production environment. A broader audit may include release pipelines, CDN behavior, cloud account structure, database topology, third-party dependencies, disaster recovery assumptions, and FinOps ownership. Mixing those scopes without agreement makes every finding look urgent.
| Symptom | Evidence To Collect | Likely Owner |
|---|---|---|
| Slow key pages | Real user monitoring, server timing, p95 and p99 latency, route-level traces | Product engineering |
| Peak traffic failures | Load balancer metrics, autoscaling events, queue depth, error rates | DevOps or platform |
| Database timeouts | Slow query logs, locks, connection pool usage, index coverage | Backend and database owner |
| High cloud cost | Utilization, idle resources, committed spend, cost per request | Engineering and finance |
2. Baseline Metrics Before Changing Infrastructure
Before changing instance sizes or autoscaling rules, capture a baseline. Good baselines combine user experience, application behavior, infrastructure utilization, and cost. A CPU chart alone cannot explain whether customers are waiting on database locks, cold starts, blocked third-party APIs, cache misses, or client-side bundle weight.
Use the same time window for related metrics. Compare a slow hour with a normal hour and a release window with the previous stable release. Mark campaign spikes, batch jobs, cache purges, migrations, third-party incidents, security scans, and deployment events; release-heavy teams can pair this with a DevSecOps pipeline checklist so performance regressions do not bypass release gates. Without that timeline, the team may optimize the wrong layer.
- User experience: page load, API response time, mobile performance, conversion drop-off, failed requests.
- Application: route timing, trace spans, error classes, retries, queue age, job duration, dependency latency.
- Infrastructure: CPU, memory, disk I/O, network throughput, container restarts, autoscaling events.
- Database: query duration, locks, scans, cache hit ratio, connection pool saturation, replication lag.
- Cost: spend by service, idle resources, over-provisioned tiers, cost per transaction or tenant.
3. Build A Cloud Performance Audit Evidence Matrix
A strong audit matrix prevents opinion-led troubleshooting. Each row should name the workflow, symptom, evidence source, threshold, owner, likely bottleneck, proposed fix, cost implication, and retest method. This is especially important when product, engineering, platform, database, and finance teams are all looking at different dashboards.
| Audit Area | Evidence To Capture | Decision It Supports |
|---|---|---|
| User workflow | RUM, session replay, conversion drop-off, API p95 and p99 latency | Which experience is worth fixing first |
| Application path | Trace spans, route timing, error classes, retry behavior, payload size | Whether code, integration, queue, or frontend work is needed |
| Database layer | Slow queries, locks, scans, connection pools, cache hit ratio, replication lag | Whether to tune, index, isolate reports, or redesign data access |
| Cloud infrastructure | CPU, memory, disk I/O, autoscaling events, load balancer metrics, CDN cache ratio | Whether to scale, right-size, pre-warm, move regions, or tune edge rules |
| Operating model | Release markers, incident history, alert quality, ownership, runbook coverage | Whether a DevOps and observability improvement should precede more infrastructure spend |
The matrix should be reviewed with the team that owns the production change. If evidence is missing, log it as an observability gap rather than filling the blank with assumptions.
4. Inspect The Application Layer For Hidden Bottlenecks
Many cloud performance issues are application issues made visible by traffic. Look for expensive routes, large payloads, duplicate API calls, synchronous work that should be queued, unbounded pagination, missing indexes triggered by ORM queries, and third-party calls inside request paths.
Trace a critical request end to end. The goal is to see where time is spent: frontend, edge, API gateway, application server, database, cache, object storage, external API, or background queue. If the team cannot trace the workflow, that observability gap becomes a finding by itself.
For older systems, the fix may become part of a legacy software modernization roadmap rather than a one-off performance patch. That is common when bottlenecks come from tightly coupled modules, brittle deployment scripts, unsupported dependencies, or database designs that cannot support current usage.
5. Review Database And Data Access Patterns
Database performance audits should start with workload shape, not just hardware size. Identify the highest-volume queries, slowest queries, lock-heavy transactions, missing indexes, connection pool pressure, N+1 patterns, expensive joins, report queries running against production tables, and background jobs competing with customer traffic.
Then separate quick fixes from structural fixes. Adding an index may be enough for one route. A reporting workload may need read replicas, materialized views, cached aggregates, or a separate analytics pipeline. A write-heavy system may need queue redesign, partitioning, or a data model review. If the bottleneck is rooted in data model fit rather than raw capacity, use a web application database selection review before committing to a larger managed tier.
| Finding | Fast Action | Longer-Term Action |
|---|---|---|
| Slow repeated query | Add or adjust index, reduce selected columns | Review data model and access pattern |
| Connection pool saturation | Fix leaks and tune pool limits | Separate worker and web workloads |
| Reports slow production | Move heavy reports off peak hours | Build reporting replica or warehouse flow |
| High lock time | Shorten transactions | Redesign write path and isolation assumptions |
6. Check Compute, Autoscaling, Network, And CDN Readiness
Cloud tuning should match the workload. Check whether services are CPU-bound, memory-bound, I/O-bound, network-bound, or waiting on dependencies. Horizontal scaling helps stateless web traffic, but it does little for a single shared database lock or a slow third-party API in the request path.
Autoscaling deserves its own review. Confirm the scaling metric, target value, warm-up time, cooldown period, minimum capacity, maximum capacity, deployment interaction, and whether the application can handle new instances safely. A service that scales after customers already see errors needs earlier signals or pre-scaling before predictable peaks. This is where cloud architecture guidance from AWS, Google Cloud, and Azure converges: performance efficiency is an operating loop of selecting the right resources, observing demand, testing changes, and improving continuously.
Also inspect CDN behavior, cache headers, static asset weight, image optimization, regional latency, TLS handshakes, DNS, load balancer rules, and egress-heavy traffic. Network and edge issues often look like application slowness until measured separately.
7. Add SLO-Aware Scaling Guardrails Before You Scale
Before adding capacity, define the user-facing SLO that the change must protect: checkout p95 latency, report completion time, API error rate, tenant import duration, or another workflow metric that a customer or operator would notice. Then connect that SLO to trace evidence, capacity policy, cost guardrails, and a release gate. This prevents teams from scaling a symptom while the real bottleneck remains in a database lock, queue backlog, cold start, integration timeout, or oversized payload.
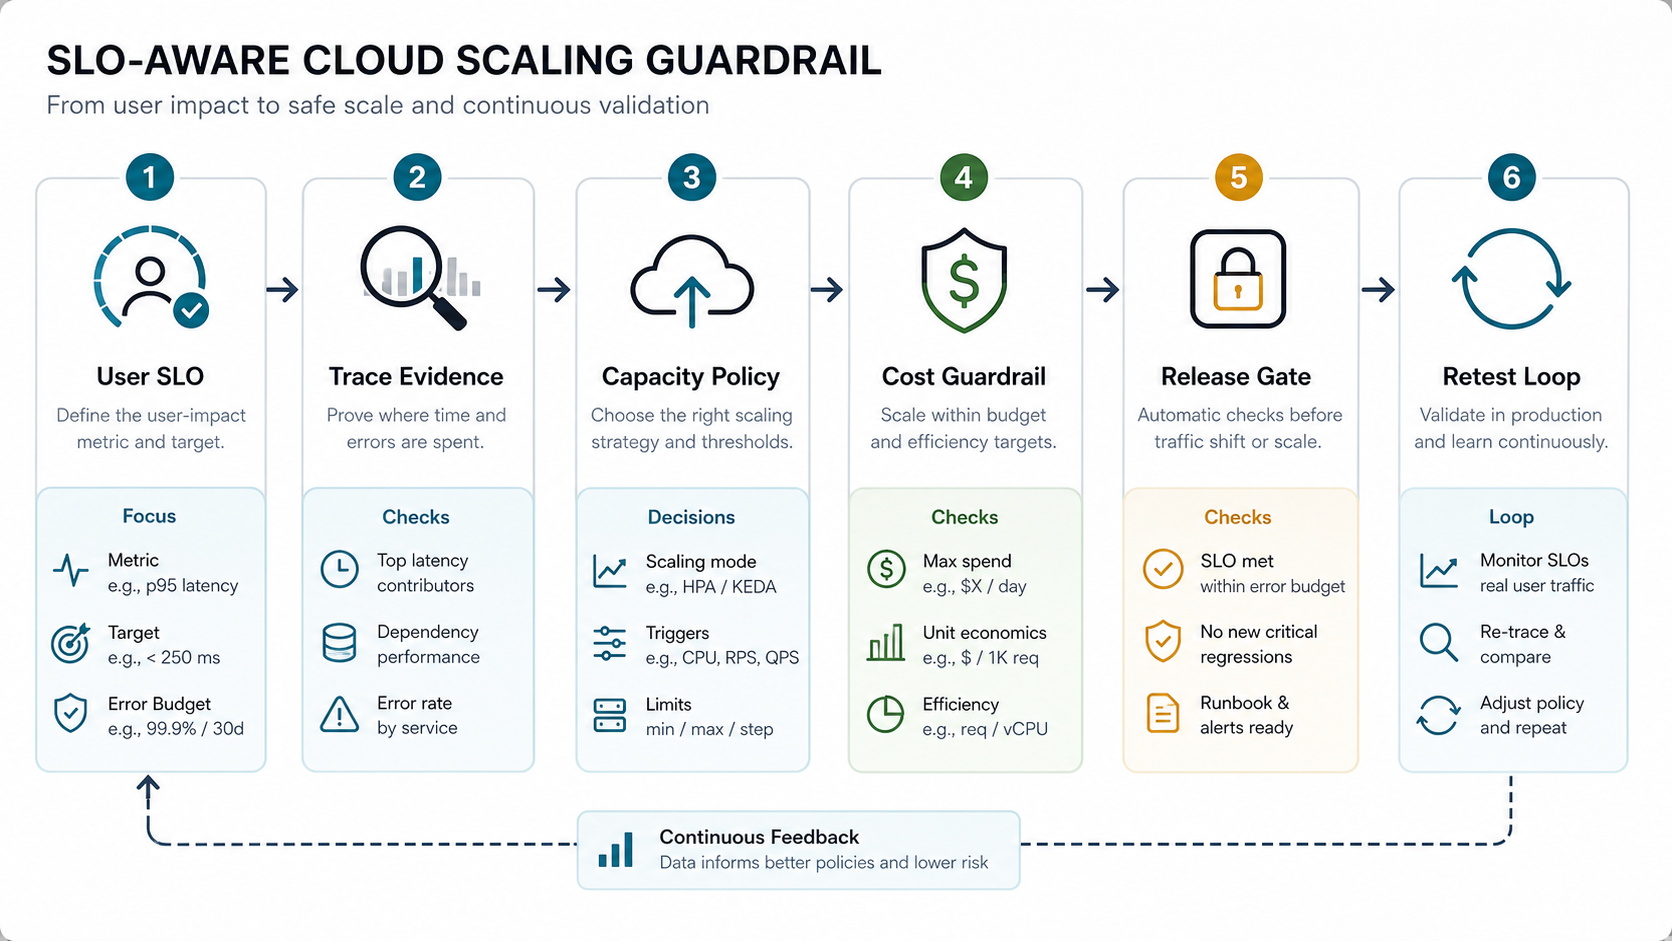
Use a simple gate for each scaling recommendation: the trigger metric, minimum and maximum capacity, cooldown or warm-up behavior, expected cost ceiling, rollback condition, and retest window. If the SLO is already missed before traffic shifts, pause the rollout and fix the dependency or application path first. Recent SLO-aware autoscaling research keeps reinforcing the same practical lesson for product teams: strict latency targets and cost efficiency have to be managed together, especially when demand changes faster than coarse infrastructure scaling signals can react.
8. Treat Observability Gaps As Audit Findings
A cloud performance audit is weak if the team cannot answer where time is spent. Check whether logs, metrics, traces, release markers, alerts, dashboards, and cost data tell the same story. If each tool shows a different slice and nobody owns correlation, the first recommendation may be instrumentation.
Use service-level indicators that the business understands: successful checkout time, report generation time, API p95 latency, failed background jobs, payment callback delay, admin dashboard load, or tenant import completion. Then map each indicator to the technical metrics that explain it. If the team lacks SLOs, incident review habits, or service ownership, pair the audit with an SRE observability roadmap so performance does not regress after the first tuning cycle.
Major cloud architecture frameworks all treat performance as an ongoing operating discipline, not a one-time hardware choice. AWS frames performance efficiency around using resources efficiently as demand changes, while Google Cloud and Azure place performance optimization or performance efficiency alongside reliability, security, cost, and operations. That matches how audits should be run: measure, change, retest, and keep watching.
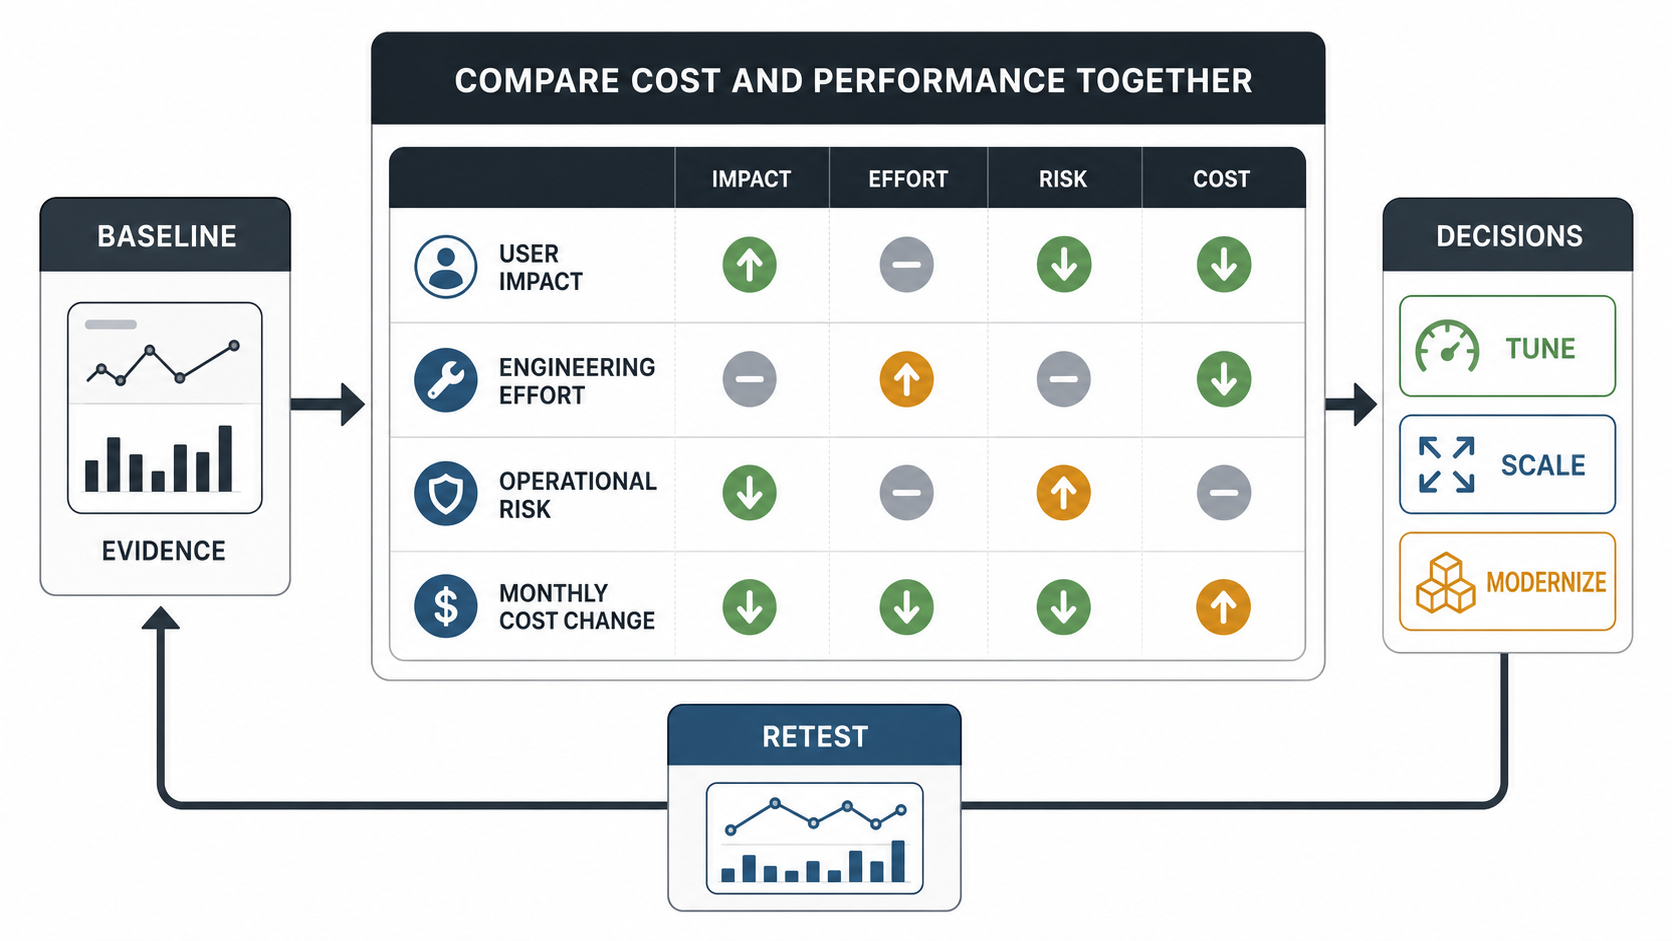
9. Compare Cost And Performance Together
Performance work should not automatically mean higher spend. Sometimes the right answer is a larger tier, but sometimes it is fewer duplicate jobs, better cache use, lower payload size, reserved capacity, right-sized containers, storage lifecycle rules, or removing idle environments.
Create a cost-performance table for the top recommendations. For each fix, estimate expected user impact, engineering effort, operational risk, monthly cost change, and how it will be verified. This keeps the team from spending heavily on infrastructure when a smaller code or database change would remove the bottleneck. For AI-heavy or automation-heavy platforms, also review token usage, job fan-out, tool calls, and observability cost because those workloads can hide cloud waste outside the core application tier.
10. Turn Findings Into A Remediation Plan
The audit output should be more than screenshots and charts. Convert findings into a prioritized remediation plan with owner, severity, evidence, proposed fix, expected impact, validation method, and rollback plan. Group actions into immediate fixes, sprint-level improvements, and architecture decisions.
Set a retest gate for every material change. The gate should name the same baseline window, the target metric, the acceptable regression risk, and the rollback or follow-up action. Without that gate, teams often ship a fix that improves one graph while hurting another workflow, increasing cloud cost, or masking the next bottleneck.
Immediate fixes might include cache headers, query indexes, queue worker counts, image optimization, or alert thresholds. Sprint-level improvements might include route tracing, report offloading, deployment health checks, background job redesign, or frontend bundle reduction. Architecture decisions might include database separation, service decomposition, cloud migration, managed service adoption, or modernization of a legacy module. If the audit points to business-process and platform change, connect it to a broader digital transformation strategy roadmap instead of treating performance as an isolated infrastructure ticket.
If the audit reveals broad engineering scope, use the custom software cost estimator to frame whether the next step is a short performance sprint, a modernization phase, or a larger platform roadmap.
Cloud Performance Audit Checklist
- List critical workflows and the user-visible symptom for each one.
- Define p95 or p99 latency, error rate, throughput, job duration, and cost targets.
- Capture real user monitoring, server traces, logs, infrastructure metrics, database metrics, and deployment markers for the same time window.
- Review route-level application timing, payload size, duplicate calls, synchronous work, retries, and third-party dependencies.
- Inspect slow queries, locks, connection pools, indexes, report workloads, and replication lag.
- Check CPU, memory, disk, network, container restarts, load balancer behavior, CDN configuration, and autoscaling policies.
- Define SLO-aware scaling guardrails with trigger metrics, cost ceilings, rollback conditions, and retest windows.
- Mark observability gaps where the team cannot connect symptoms to evidence.
- Compare each fix by user impact, engineering effort, risk, validation method, and cost change.
- Define a retest gate for each approved fix so the same baseline proves whether performance improved.
- Retest after each material change and keep the baseline for future audits.
How NextPage Helps With Cloud Performance Audits
NextPage helps teams turn vague performance complaints into an evidence-backed remediation plan. We map the critical workflows, collect metrics across application and cloud layers, inspect database and integration bottlenecks, review observability gaps, and separate quick tuning from modernization or migration decisions.
If your cloud application is slow, unreliable under peak traffic, or expensive without clear performance gains, start with a focused audit before committing to larger infrastructure spend. The outcome should be a practical set of fixes, owners, and validation steps that your team can execute.