
Quick Answer: What Demand Forecasting Software Does
Demand forecasting software helps retail and eCommerce teams predict future demand by combining historical sales, seasonality, product hierarchy, promotions, marketplace signals, inventory positions, pricing context, and external events. The output is not just a chart. A useful forecasting system turns predictions into replenishment decisions, pricing scenarios, stockout alerts, purchasing recommendations, and dashboards that planners can act on.
For most retailers, the practical goal is simple: reduce stockouts without creating avoidable overstock. That means the software must connect data from POS, ERP, warehouse, eCommerce, marketplace, marketing, and finance systems. NextPage approaches this as production AI development services, not a one-off model experiment: define the operating decision first, then build the smallest forecasting loop that can improve it.
Why Retail Forecasting Fails When It Stays In Spreadsheets
Spreadsheets are flexible, but they become fragile when SKUs, locations, channels, promotions, and lead times multiply. A planner may know the business well, but manual forecasting struggles to keep pace with marketplace volatility, new product launches, regional demand swings, fulfillment constraints, and supplier delays.
The common failure pattern is not that teams lack data. They usually have too much scattered data: sales exports in one place, promotion calendars in another, stock adjustments inside ERP, marketplace reports in CSVs, and pricing changes in a merchandising tool. The forecast becomes a monthly spreadsheet exercise instead of a living system that learns from actual outcomes.
Good forecasting software does not replace retail judgment. It gives planners a consistent baseline, flags exceptions, exposes confidence levels, and makes it easier to compare the plan against what actually happened.
How Demand Forecasting Software Works
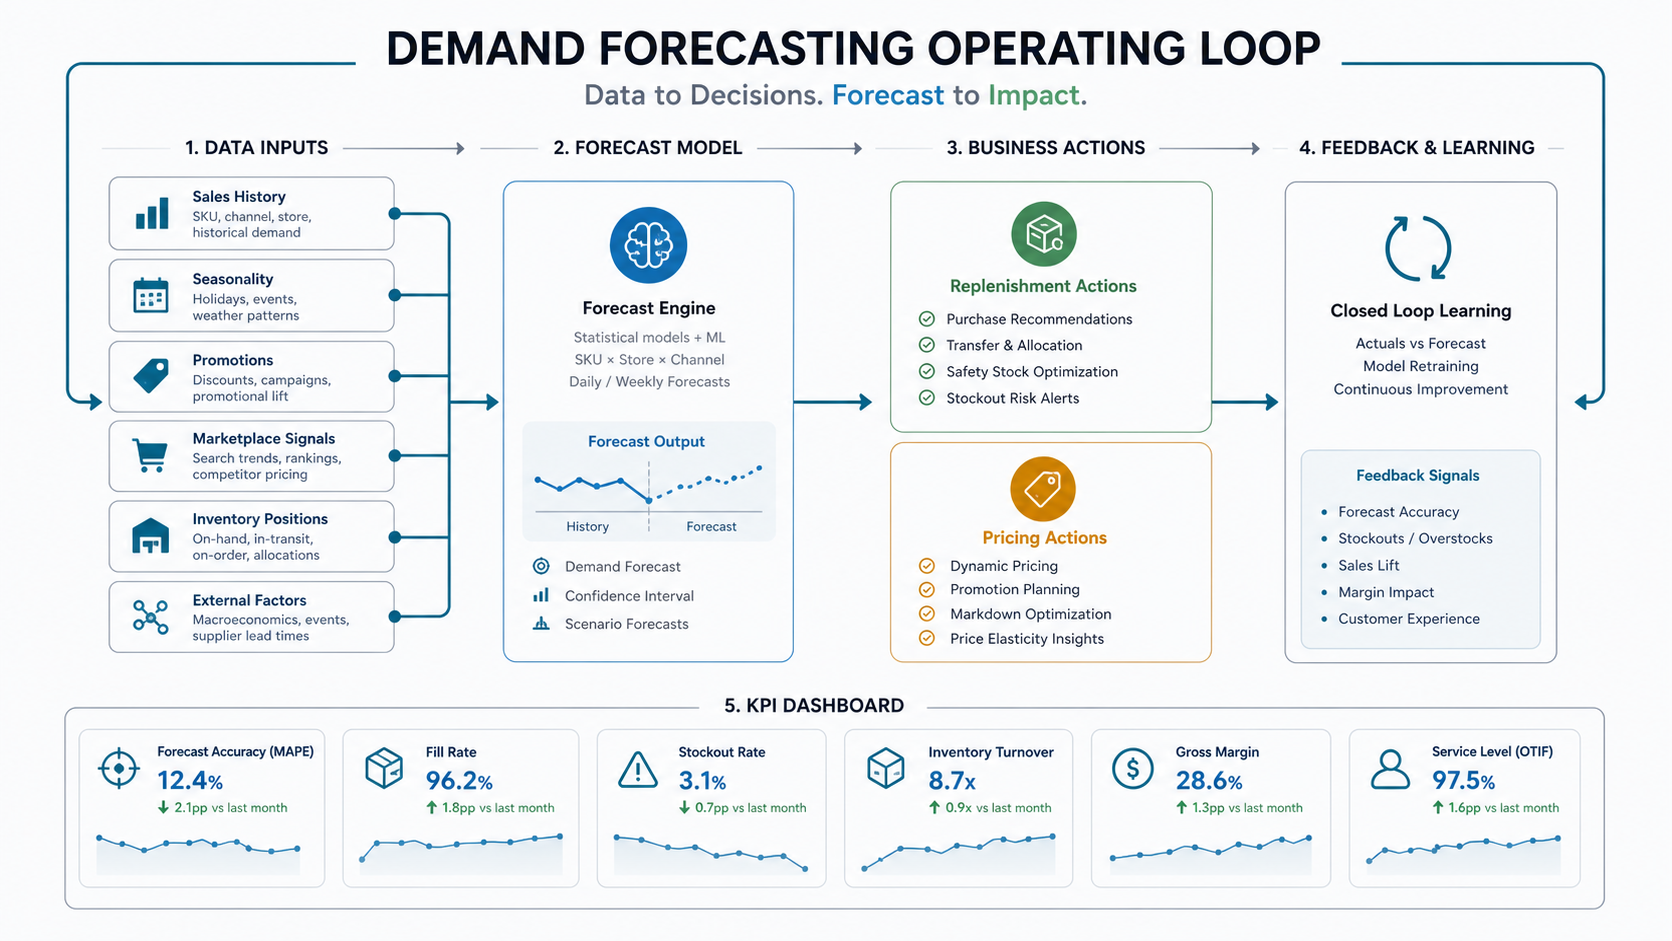
A reliable forecasting system usually has five layers. First, a data pipeline pulls and cleans sales, returns, inventory, promotions, price, product, channel, and fulfillment data. Second, a feature layer converts that raw data into usable signals such as seasonality, moving averages, discount depth, stockout days, launch age, regional demand, and marketplace rank. Third, forecasting models predict demand at the level the business can act on, such as SKU-location-week or SKU-channel-day.
Fourth, a decision layer translates forecasts into reorder quantities, safety stock recommendations, pricing scenarios, campaign allocation, or exception queues. Fifth, dashboards and alerts show planners where to intervene. This is why forecasting projects belong close to machine learning development, data engineering, and workflow software, not only BI reporting.
| Layer | What It Does | Retail Example |
|---|---|---|
| Data pipeline | Collects and normalizes source data | POS sales, Shopify orders, ERP stock, ad campaigns, returns, supplier lead times |
| Feature layer | Turns raw history into model-ready signals | Seasonality, holiday windows, discount depth, product age, stockout days |
| Forecast model | Predicts demand at a useful planning grain | SKU-location-week demand for replenishment planning |
| Decision layer | Converts prediction into action | Reorder alerts, transfer recommendations, price tests, campaign warnings |
| Feedback loop | Compares forecast to actuals and improves the process | Forecast error by category, planner override tracking, lost-sales estimate |
Data Inputs A Forecasting System Needs
The best forecasting model cannot rescue unreliable source data. Before choosing software, map the inputs that matter for the decisions you want to improve.
- Sales history: orders, units sold, net sales, returns, cancellations, channel splits, and fulfillment status.
- Inventory history: stock on hand, stockout periods, inbound purchase orders, transfer history, shrinkage, and safety stock rules.
- Product hierarchy: SKU, variant, category, brand, collection, lifecycle stage, size, color, bundle, and substitute relationships.
- Pricing and promotions: price changes, discount depth, coupon usage, campaign calendars, markdowns, and merchandising events.
- Demand signals: search trends, marketplace rank, ad spend, email campaigns, regional events, weather, and competitor moves when available.
- Operational constraints: supplier lead times, minimum order quantities, warehouse capacity, shelf life, shipping cutoff, and procurement calendars.
For an MVP, do not wait for perfect data. Start with the data that explains the most valuable decision, then record known blind spots so planners understand where the model is confident and where human review is still necessary.
High-Value Retail And eCommerce Use Cases
Demand forecasting software becomes easier to fund when it is attached to specific operating decisions. The same forecast can support multiple teams, but each use case needs a clear owner and KPI. Teams that already use pricing tests should connect forecast output to the dynamic pricing software roadmap so merchandising, inventory, and margin decisions are not optimized in separate tools.
| Use Case | Forecasting Question | Business Action | Primary KPI |
|---|---|---|---|
| Inventory replenishment | How much demand will each SKU-location need next period? | Reorder, transfer, or hold stock | Stockout rate, inventory turns, fill rate |
| Overstock reduction | Which products are likely to miss sell-through targets? | Markdown, bundle, reallocate, or slow purchasing | Aged inventory, gross margin, carrying cost |
| Promotion planning | What demand lift should a campaign create? | Adjust stock, channel spend, and fulfillment capacity | Promo sell-through, lost sales, margin impact |
| Dynamic pricing support | How will demand change under price scenarios? | Run markdown, premium, or clearance tests | Revenue, margin, conversion rate |
| New product launch | How should a new SKU be planned with limited history? | Use similar products and early demand signals | Launch stockout rate, first 30-day sell-through |
Reference Architecture And Integrations
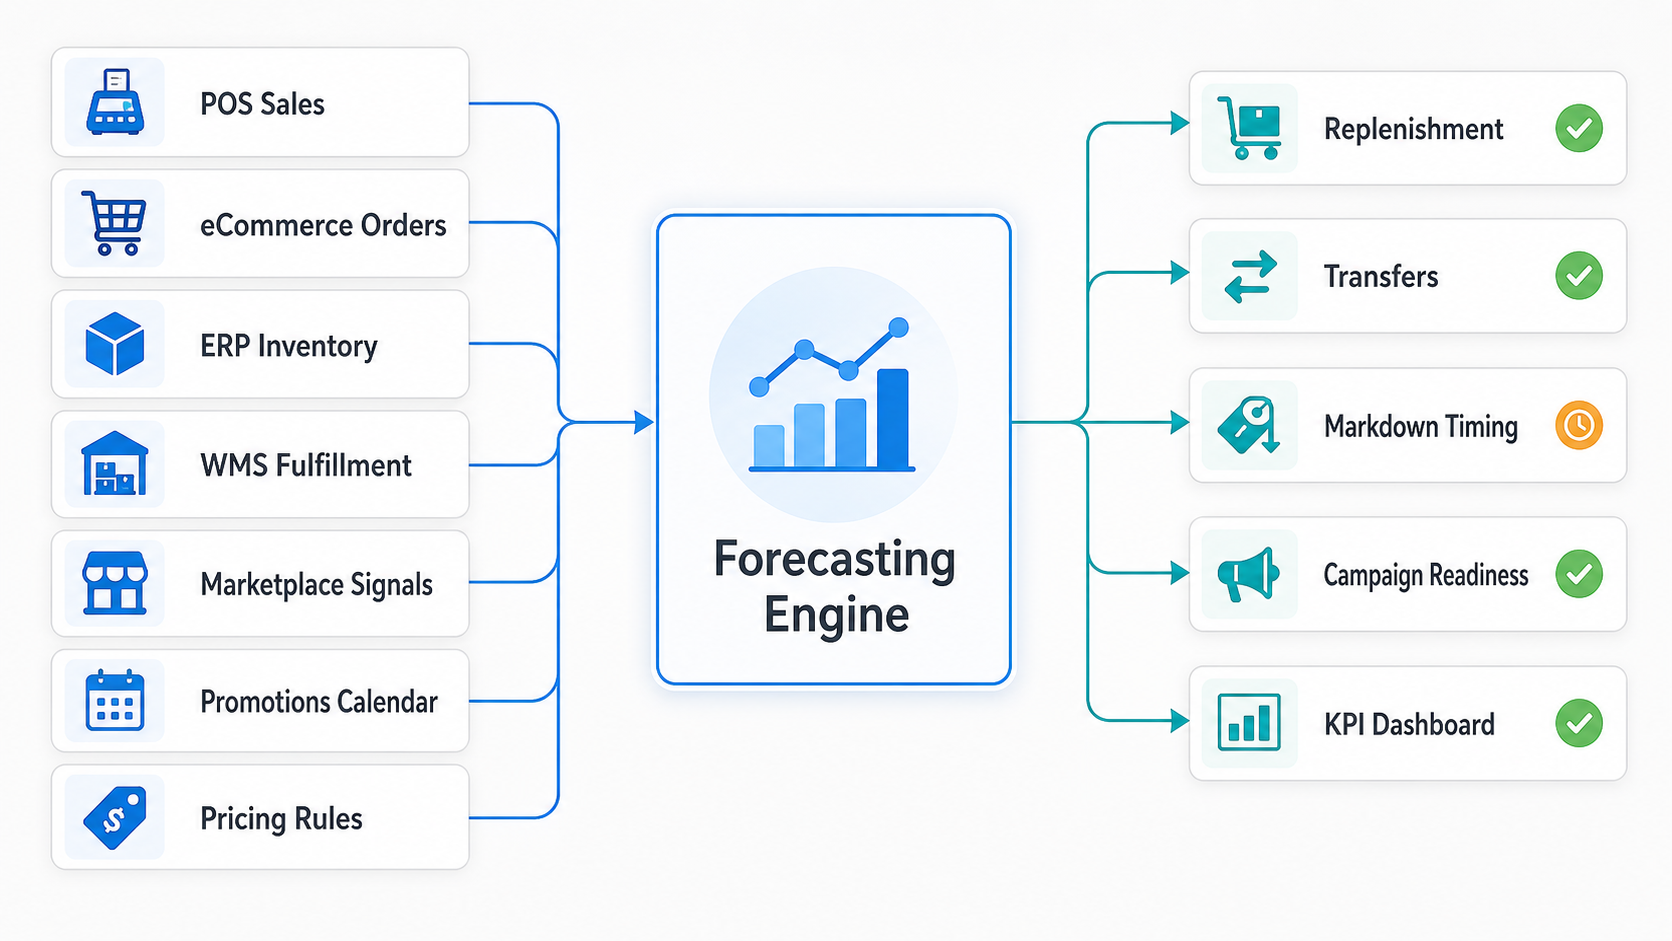
A retail forecasting platform is usually an integration project before it is a modeling project. The software needs reliable access to order history, product catalog, inventory, pricing, marketing, and fulfillment data. It also needs a path back into the systems where decisions happen.
Typical integrations include ERP or inventory systems for stock and purchase orders, POS for store sales, eCommerce platforms for online orders, marketplaces for channel demand, WMS for warehouse status, CRM or CDP for customer segments, and BI tools for executive reporting. If the system only produces a separate dashboard, adoption will be weak. Forecast output should appear where planners already review replenishment, purchasing, pricing, and campaign decisions.
Security and access control matter because these systems often touch revenue, supplier, margin, customer, and operational data. Define which users can view forecasts, override recommendations, approve replenishment actions, and export data.
Integration Architecture: Where Forecasts Need To Connect
A forecasting platform creates value when it is wired into the systems where retail work already happens. Treat the model as one part of a larger operating architecture: source systems feed clean demand signals, the forecasting engine creates predictions and confidence bands, and downstream workflows turn that output into replenishment, transfer, markdown, campaign, or dashboard actions.
For eCommerce teams, this architecture often touches catalog, cart, checkout, promotions, fulfillment, and analytics systems. The eCommerce app development cost guide is useful when those commerce workflows and integrations are still being scoped alongside forecasting.
Forecasting also depends on resilient commerce infrastructure. If product listing, cart, or checkout events arrive late or inconsistently, forecast freshness suffers. For high-traffic retailers, pair the forecasting roadmap with the eCommerce cloud performance optimization checklist so demand signals stay reliable during campaign spikes.
Demand Forecasting Readiness Checklist
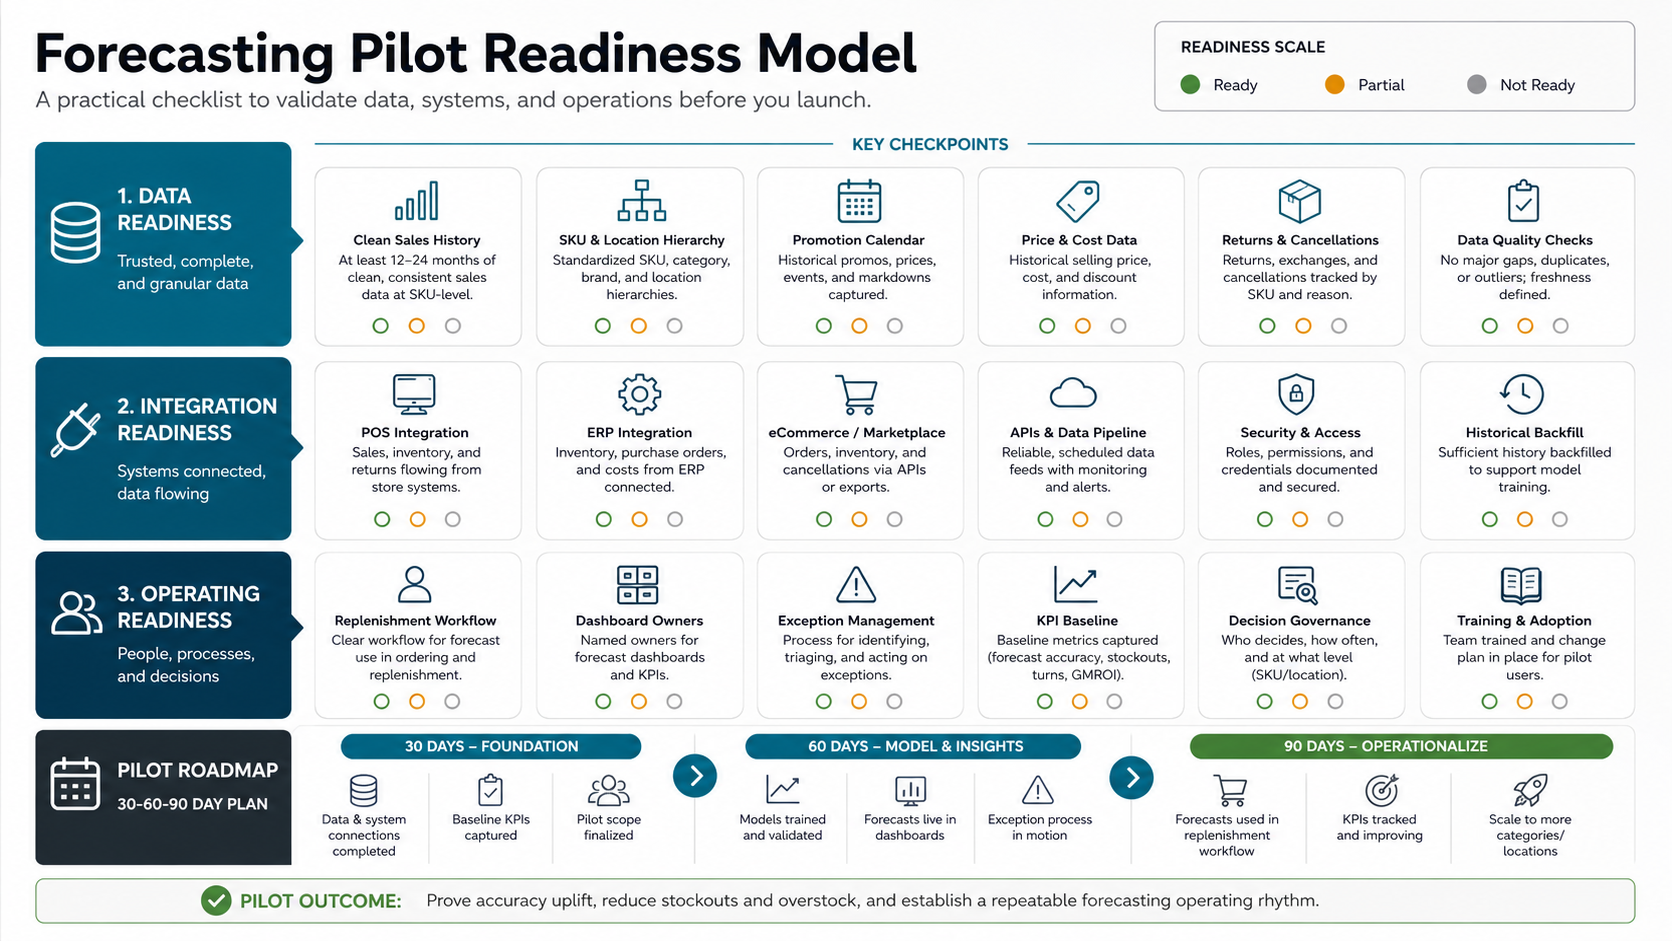
Use this readiness checklist before funding a build or buying a platform. It is adapted for forecasting, but the broader enterprise AI readiness checklist logic still applies: workflows, data, security, governance, and ownership matter more than model hype.
- Can you identify the planning decision the forecast will improve?
- Do you have at least 12-24 months of usable sales history for priority categories, or a fallback for new products?
- Can you distinguish true low demand from stockout-constrained sales?
- Are SKU, variant, category, location, and channel identifiers consistent across systems?
- Can you connect promotion, price, and campaign history to demand changes?
- Can planners explain when they would override a recommendation?
- Are success metrics agreed before the pilot starts?
- Is there an owner for model review, data fixes, and post-launch iteration?
A Practical 30-60-90 Day Pilot Roadmap
Start with a narrow pilot instead of trying to forecast every SKU. Pick one category, one channel, or one fulfillment region where the business impact is visible and the data is accessible.
| Phase | Focus | Deliverable |
|---|---|---|
| Days 1-30 | Decision framing and data audit | Target use case, KPI baseline, source-system map, data gaps, pilot category |
| Days 31-60 | Prototype forecast and planner review | Initial model, forecast dashboard, exception list, confidence bands, override workflow |
| Days 61-90 | Operational pilot | Replenishment or pricing recommendations used in planning, actual-vs-forecast tracking, rollout decision |
The goal of the pilot is not perfect accuracy. It is evidence: whether the forecast is directionally useful, whether planners trust it, whether the data pipeline is maintainable, and whether the business case justifies the next integration step.
ROI Metrics To Track Before And After Launch
Forecasting ROI should be measured with operational metrics, not only model accuracy. Accuracy matters, but the business cares about fewer stockouts, less overstock, better cash conversion, improved margin, faster planning cycles, and fewer emergency decisions.
- Stockout rate: percent of demand lost or delayed because inventory was unavailable.
- Forecast accuracy: MAPE, WAPE, bias, or category-level error trends.
- Inventory turns: how quickly inventory converts into sales.
- Overstock and aged stock: inventory sitting beyond planned sell-through windows.
- Planning time: hours spent consolidating spreadsheets, reconciling data, and building manual forecasts.
- Promotion readiness: percentage of campaigns launched with enough stock and fulfillment capacity.
- Margin impact: reduced markdowns, fewer expedited shipments, better purchase timing, and smarter pricing decisions.
Before a larger build, use the AI Automation ROI Calculator to estimate the value of reducing manual planning and repeated analysis work. Then compare that with the cost of data cleanup, integration, dashboards, and support.
Forecast Accuracy, Bias, And Drift Gates
Forecasting software should not move straight from a prediction to a purchase order without quality gates. Retail and eCommerce teams need a recurring review that separates normal forecast error from bias, demand drift, promotion anomalies, and data freshness problems. The goal is not to chase a perfect accuracy number. It is to know when the forecast is good enough to automate replenishment, pricing, transfer, or campaign decisions and when a planner should pause the recommendation.
Use WAPE for overall volume accuracy, MAPE or sMAPE when the portfolio makes percentage error useful, forecast bias to catch repeated over-ordering or under-ordering, and tracking signals to flag drift before a bad forecast creates stockouts or overstock. Measure at the same grain where decisions happen: SKU, store, channel, category, supplier lead time, or promotion window. A weekly executive dashboard can summarize accuracy, but replenishment gates often need daily or event-based checks for fast-moving categories.
| Forecast Signal | Decision It Supports | Operational Gate |
|---|---|---|
| WAPE or weighted error | Whether the model is accurate enough for volume planning | Review by category, channel, and lead-time horizon before auto-replenishment |
| Forecast bias | Whether the system is consistently over- or under-forecasting | Block automated purchase increases when bias crosses the agreed threshold |
| Tracking signal or drift alert | Whether demand behavior has changed since the model was trained | Route affected SKUs to planner review and retraining backlog |
| Promotion and event error | Whether campaign lift assumptions are reliable | Require manual approval for launch, festive, influencer, or marketplace events |
| Override reason and outcome | Whether planners improve or weaken recommendations | Feed accepted overrides, rejected overrides, and realized sales back into model review |
This gate also changes the vendor conversation. Ask whether the platform can show forecast accuracy by decision horizon, explain why an exception was raised, store planner override reasons, and trigger retraining when demand patterns shift. If those controls are missing, the buyer is not only choosing a model; they are accepting operational risk inside inventory, margin, and customer availability decisions.
Build vs Buy: When Custom Forecasting Software Makes Sense
Buying a forecasting platform can work when your workflows fit standard connectors, your catalog is straightforward, and you mainly need faster planning visibility. Custom forecasting software makes more sense when demand planning is tied to proprietary data, unusual business rules, marketplace logic, supplier constraints, multiple channels, or custom replenishment workflows.
Use a custom or hybrid path when you need the forecast to sit inside existing purchasing, ERP, WMS, or eCommerce workflows. Also consider custom development when the business needs explainable recommendations, planner override history, custom dashboards, category-specific logic, or phased rollout across regions and brands. If the real need is a planner workbench, exception queue, approval flow, or reconciliation screen, compare the scope with NextPage's internal tool development guidance before forcing the workflow into a generic forecasting product.
For budget planning, compare build scope against the main custom software development cost drivers and run a first-pass estimate with the Custom Software Cost Estimator. Most of the cost will come from integration, data quality, dashboards, and operating workflow design, not from the forecasting algorithm alone.
Operating Model: Human Review, Exceptions, And Monitoring
Forecasting software should make planners faster, not invisible. Keep human review in the loop for high-value categories, unusual spikes, new launches, supplier disruption, and low-confidence forecasts. The system should explain why a recommendation changed and what data influenced it.
Think of forecasting as AI workflow automation: data comes in, the system predicts, rules convert prediction into a suggested action, people review exceptions, actions are recorded, and outcomes feed the next cycle. Without that loop, the model becomes another report that teams stop trusting.
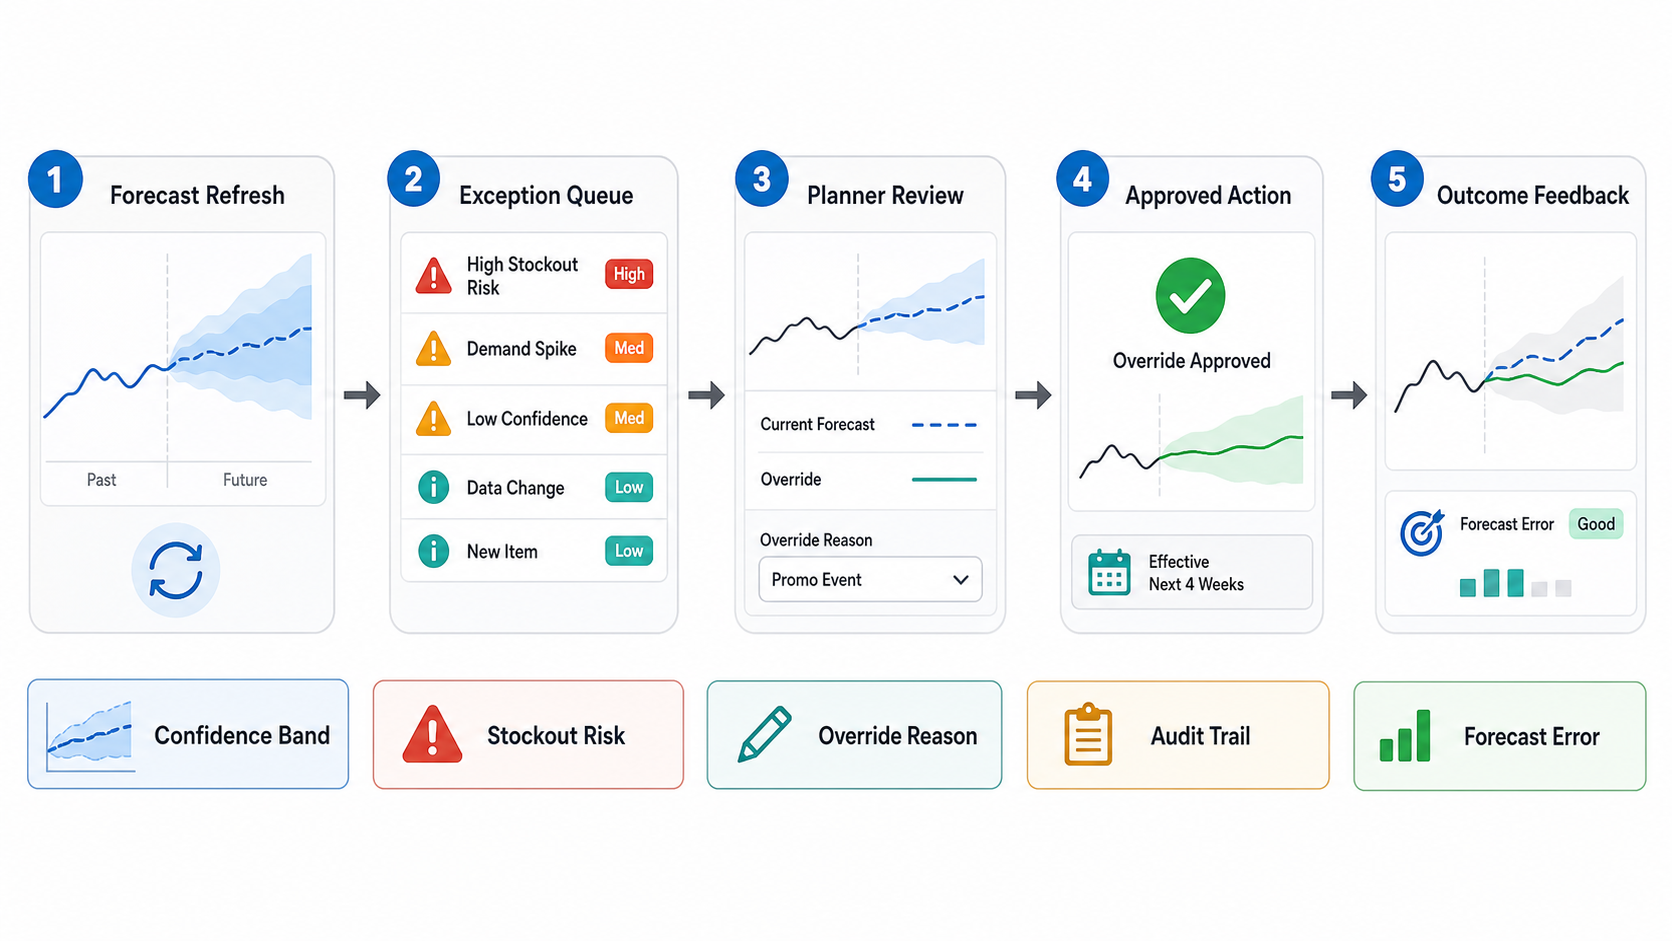
Post-launch monitoring should track forecast error by category, model drift, data freshness, missing feeds, planner overrides, stockout exceptions, and business KPI movement. If the model is not changing decisions, it is not production software yet.
How NextPage Helps Retail Teams Build Forecasting Software
NextPage helps retail and eCommerce teams turn forecasting ideas into scoped, buildable software. We map the planning workflow, audit source data, define pilot KPIs, design the integration architecture, build dashboards and exception workflows, and connect forecasting outputs to replenishment, pricing, campaign, or procurement actions.
Our custom software development work covers the platform pieces around the model: source-system integrations, workflow UI, role-based access, API design, dashboards, audit trails, and production support. If your team is deciding whether to buy, customize, or build demand forecasting software, start with a readiness review and a small pilot category. That creates better evidence than a broad platform rollout.
Book a demand forecasting readiness consultation with NextPage.